Burnaby continues to see a drop in new COVID-19 infections, but some of the city’s neighbourhoods are still being called high-transmission areas.
According to the latest Geographic Distribution of COVID-19 by Local Health Area of Case Residence data, Burnaby recorded 247 cases between March 2 and 8 – a drop from the 309 new infections from April 25 to May 1. From April 18 to 24, the city hit 397 cases.
The data is released by the BC Centre for Disease Control (BCCDC).
Burnaby has now seen more than 200 cases for 12 straight weeks and saw a record number of new infections of 475 from April 4-10.
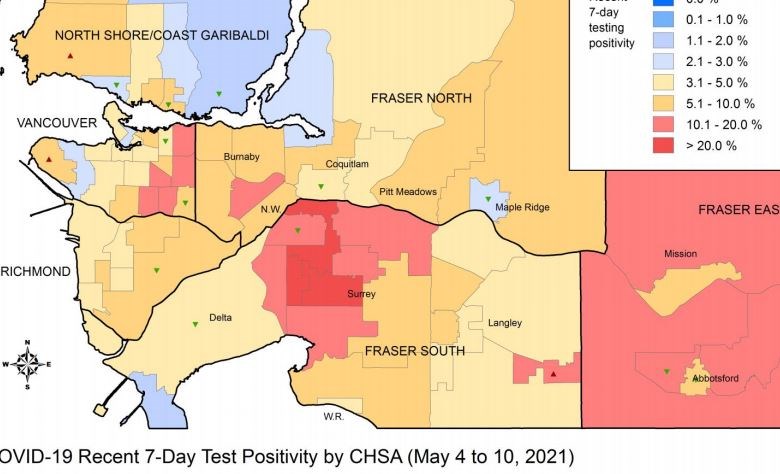
Some areas of South Burnaby are considered high-transmission areas based on the concentration of cases, according to Fraser Health and a new map from the BCCDC (see above).
The map shows a positivity rate of 10 to 20% from May 4-10 in South Burnaby – mostly southeastern Burnaby.
These new maps have been released to show new coronavirus cases down to the community level.
The maps show the testing positivity rates in communities located within local health areas. So far, the province is only providing community-level data for Metro Vancouver, Abbotsford, Greater Victoria and Kelowna.
Each week, the BCCDC releases an update of the COVID-19 cases for the most recent seven-day period (Sunday to Saturday). Previously, it only provided information for local health areas, rather than community-level data.
Provincial Health Officer Dr. Bonnie Henry told reporters during her May 10 COVID-19 briefing that information on case and immunization rates in community health service areas would be available in maps starting this week.
"You'll be able to look at more granular detail by mostly community health service area — and I say mostly because there are some smaller population centres in the province, mostly rural ones where we only can present by local health area, because the community and parts of the community can be identifiable," she said.
For now, the information will be presented in "static" maps, but Henry stated that health officials "have been working on developing an interactive mapping app so that you can actually look at different neighbourhoods, by both age and sex and that will also be available in the coming days."
- With additional reporting by Glen Korstrom, Glacier Media


