For Burnaby residents flocking to parks as an escape from the confinement of their homes during the COVID-19 pandemic, it may be difficult to know ahead of time what amenities are closed and which are open, but a digital mapping project from the city aims to clear that up.
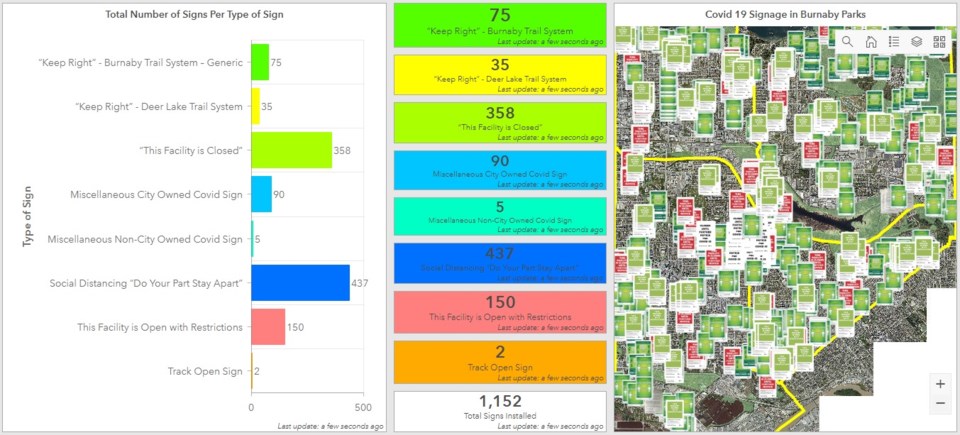
The city has posted nearly 1,200 signs in its 160-plus parks, and the parks and recreation department has a small team dedicated to tracking those signs and posting them online through geographical information system (GIS) mapping.
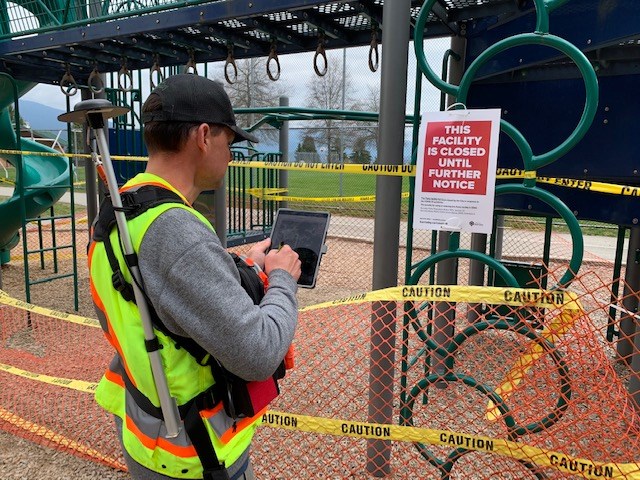
A pair of employees have been attending all of the city’s parks and taking photos of the COVID-19-related signs. They then attach GPS coordinates to the image, and the information is processed by a team of two who upload the information to an interactive map, posted to the city’s COVID-19 resource page.
As of early Friday afternoon, 1,152 signs had been documented in the interactive map, including 442 for facility closures, 437 advising amenity patrons of physical distancing protocols and 112 indicating facilities are open with restrictions.

The map also notes closed parking lots and where trails are designated as one-way walking routes – around Deer Lake, namely.
“This has just been an ongoing thing that’s just overwhelmed us,” Wilson said. “But it’s cool stuff, right? Because now people can go in, you can look at it and see … the lacrosse box and see, ‘Oh, that’s all closed, still.’”
Having a public map of closures and restrictions is becoming all the more important as the city begins to open some of its facilities, said city GIS specialist Rob Wilson.
Earlier this week, the city announced it would be opening some of its boat launches, public washrooms, sports fields for casual use, sports courts (tennis, pickleball, badminton, bocce, horseshoe, table tennis, tetherball, volleyball), skate parks, a disc golf course, a pair of bike parks and the track at Swangard Stadium.
Trevor Morgan, with the asset management and GIS division of the parks and recreation department, said he spent much of Friday tracking those changes in the map. That meant finding spots where signs used to say a field was closed and updating the map with the new sign that indicates the fields are open with restrictions.
The GIS mapping has come in handy particularly during the COVID-19 pandemic – Wilson said he’s heard positive feedback from the public, and the city has heard from other local governments interested in what they’re doing. But it’s also part of a larger program the city is running, primarily to map and track all of the city’s assets.
The program, which has been running for two years so far, will eventually be useful both to the public and to the city’s maintenance crews.
For the public, it will mean tracking where they can bring their barbecues, where nearby playgrounds are and whether they’re open, where there are benches available for picnics and more.
For maintenance crews, the maps will track infrastructure and include condition reports, making it easier for crews to know where work needs to be done and when.
“This is where I’m working on developing this,” Wilson said, “to get the work out efficiently in the field for people to do the work; they’re not having the old-school phone call, back and forth.”


