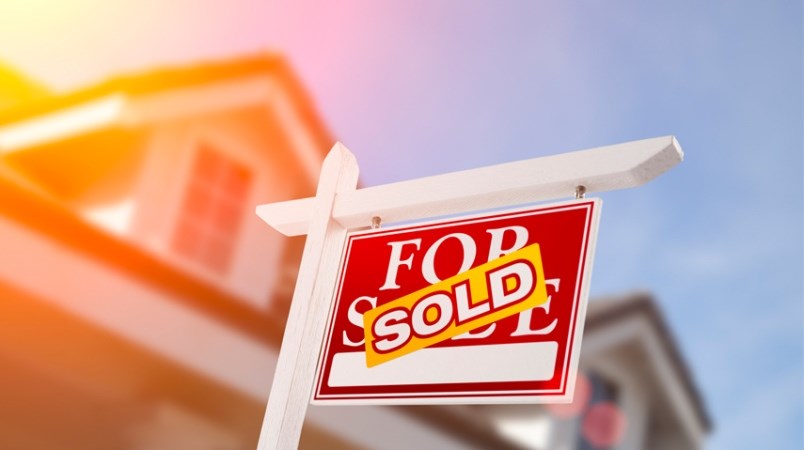
Home sale and new listing activity remained at near-record levels across Metro Vancouver in October – with Burnaby seeing astronomical price increases in certain parts of the city and certain types of properties.
The Real Estate Board of Greater Vancouver (REBGV) reports that residential home sales in the region totalled 3,687 in October 2020, a 29-per-cent increase from the 2,858 sales recorded in October 2019, and a 1.2-per-cent increase from the 3,643 homes sold in September 2020.
Last month’s sales were 34.7 per cent above the 10-year October sales average and stands as the second-highest total on record for the month.
A look at the numbers for Burnaby in the REBGV price index shows the city split into three areas, East, North and South.
For the residential/composite, the benchmark price was $991,000 for East, $898,000 for North and $970,000 for South.
For single-family detached houses, East was $1,281,000, and North and South were $1.5 million.
When comparing October 2020 prices and October 2019, single-family detached houses jumped 11.1 per cent in East, 10 per cent in North and 6.2 per cent in South.
For the residential composite, East jumped 7.5 per cent, North 5.6 and South 3.4 during hte same period.
“Home has been a focus for residents during the pandemic. With more days and evenings spent at home this year, people are re-thinking their housing situation," Colette Gerber, REBGV chair said.
There were 5,571 detached, attached and apartment homes newly listed for sale on the Multiple Listing Service in Metro Vancouver in October 2020. This represents a 36.7-per-cent increase compared to the 4,074 homes listed in October 2019 and a 13-per-cent decrease compared to September 2020 when 6,402 homes were listed.
The total number of homes currently listed for sale on the MLS system in Metro Vancouver is 12,416, a 1.5-per-cent increase compared to October 2019 (12,236) and a 5.2-per cent-decrease compared to September 2020 (13,096).
For all property types, the sales-to-active listings ratio for October 2020 is 29.7 per cent. By property type, the ratio is 30.9 per cent for detached homes, 43.5 per cent for townhomes, and 24.9 per cent for apartments.


